by Charles River Interactive | May 31, 2018 | Analytics, Industry Trends
By now most marketers have realized the reporting advantages of Google Data Studio. It offers advanced reporting visualization and an impressive level of customizability to show data in the best way for your visualization needs. Check out our previous blog to learn more about Data Studio.
What is Supermetrics?
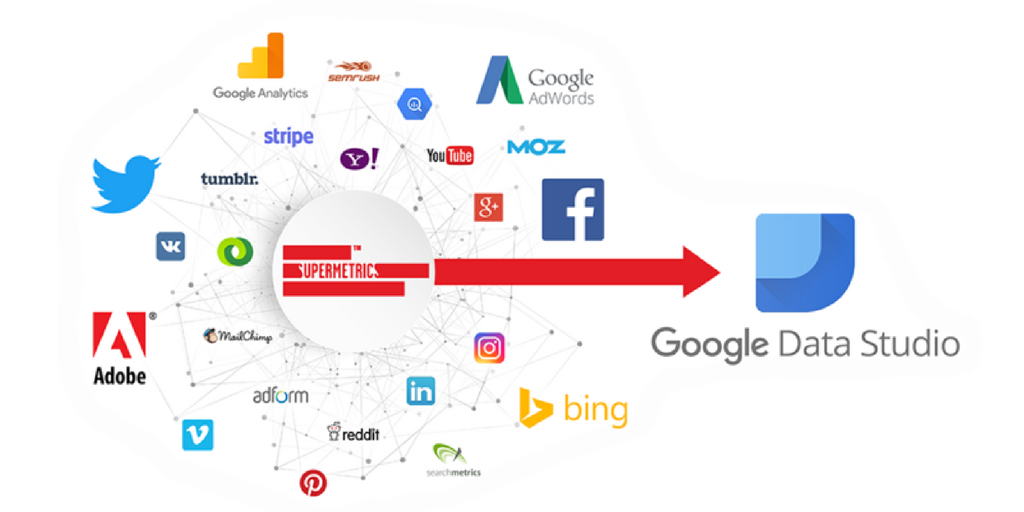
Supermetrics is an Application Programming Interface (API), which is a fancy way of saying it’s a software that allows two applications to talk to each other. In this case, Supermetrics allows marketing platforms, like Facebook, to send data directly into Data Studio. No more exporting and manipulating data in Excel or Sheets for reporting!
In most organizations, and in virtually every marketing agency, reporting requires a significant time investment for data exporting and manipulation, often in either Excel or Google Sheets. At Charles River Interactive, we estimate adopting Google Data Studio with the Supermetrics API has saved us over 150 hours of work. That’s more time we get to spend focusing on driving results for our clients.
Why do you need Supermetrics?
A key selling point for Data Studio is the ease of integration with certain marketing platforms—in particular, with Google’s owned properties, including AdWords and Google Analytics. And, while that might account for a fair amount of many companies’ marketing efforts, there is no shortage of ad networks or marketing tools. The Supermetrics API lets you easily bring even more data sources into Data Studio!
Supermetrics allows you to connect non-Google platforms to Data Studio. It has over 30 connectors, including Bing Ads, Facebook Ads, LinkedIn Ads and more! Within each connector, you are able to blend data from more than one account.
Combine Ad Data and Google Analytics Data
The Ad Data + Google Analytics connector allows you to merge data from different ad networks and Google Analytics. You can combine data from any of the following into one data source; Facebook Ads, Google AdWords, Bing Ads, Twitter Ads, LinkedIn Ads, and Google Analytics. There are many useful arrangements of data now possible with this connector!
 Pro Tip 1 – Connect Google Analytics to each of the ad networks to see how users from different ad networks behave on your site.
Pro Tip 2 – Merge Google AdWords and Bing Ads data to get a holistic view of PPC performance.
Pro Tip 3 – Connect all your social networks to see your overall social performance and compare performance across platforms effortlessly.
Improved Google connectors
Google Data Studio has 14 Google Connectors, build and supported by Data Studio, including Google Analytics and Google AdWords. Supermetrics provides improved versions of some of these Google Connectors.
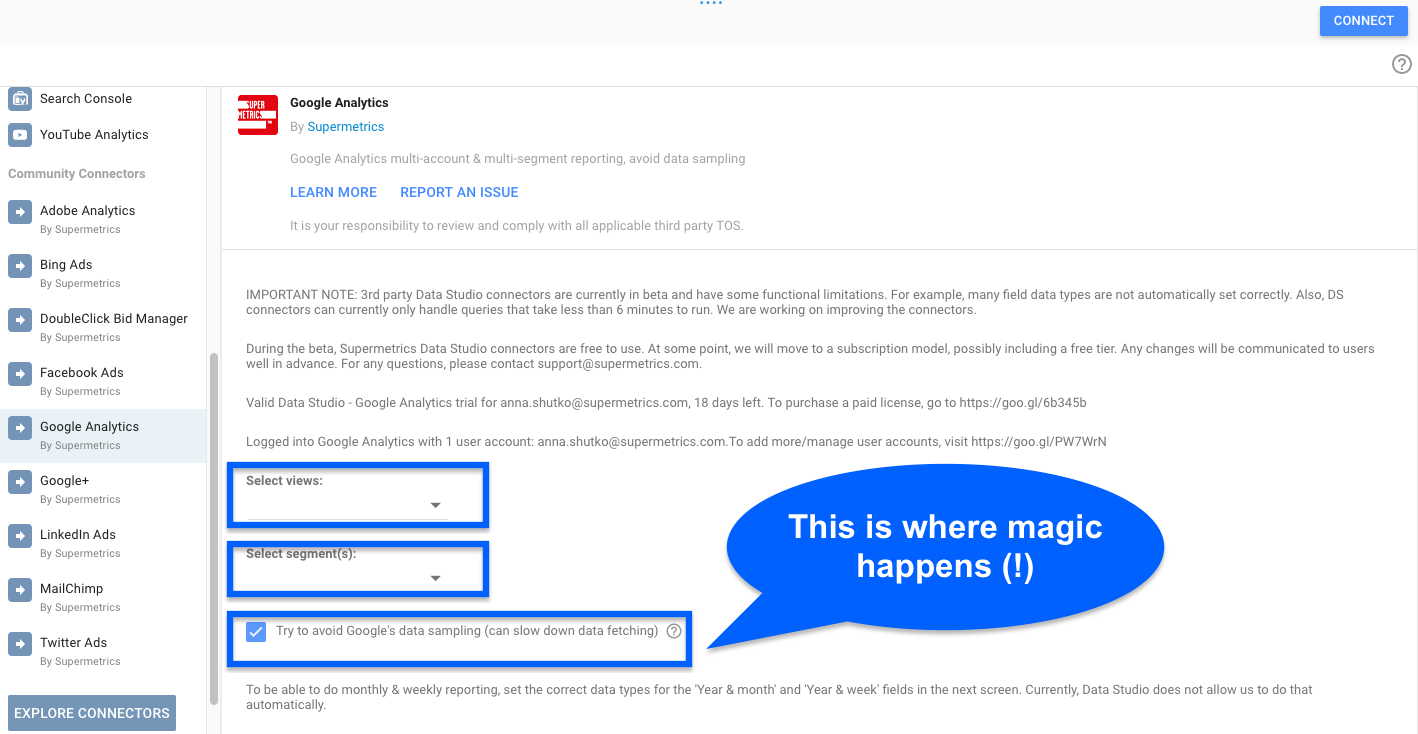
The Supermetrics Google Analytics connector allows you to connect as many Google Analytics views and segments as you want, in an easy to use drop-down menu. Data sampling in Analytics is also a problem when reporting on long date ranges or websites with high traffic volume. The Supermetrics Google Analytics connector allows you to avoid sampling by selecting the “try to avoid sampling” option in the data source menu. The connector will partition the data into smaller queries in order to process the data without sampling. Note that when using this feature it may take several minutes to process the data request, as in most cases this is why Google samples the data.
The Supermetrics AdWords connector also allows you to connect more than one account to a single data source—if, for example, you had three different AdWords accounts but you wanted to display the overall performance across all accounts. Another unique feature of this connector is the historical quality score metric.
Historical quality score is one of AdWords’ newer metrics. It reflects how relevant your ad is to the user-specific search query. This connector also pulls in placement metrics for your Display Network campaigns, including Placement URL, Domain, Placement status, Extension type, and Placement destination URL. These metrics are not available in the stock Google connector.
5 Ways Supermetrics will enhance your Data Studio reporting
In Conclusion
You haven’t even cracked the full potential of using Data Studio if you haven’t integrated it with Supermetrics. If this article gets you interested in trying out Supermetrics with Data Studio for your organization, there is a 14-day free trial! There is also a free “hobby” level of access which only allows you to see the last 10 days of data, but that’s enough for you to see firsthand that you’re missing out on the full potential of Data Studio if you haven’t integrated it with Supermetrics.
These five advantages are just the beginning; you can do so much more with Supermetrics for Data Studio. Move your organization away from manual data reporting. Use your time for more productive things!
Now go and enhance your Data Studio reports with Supermetrics!
by Charles River Interactive | May 14, 2018 | Industry Trends, Local SEO, Organic Search, SEO, Uncategorized
“Alexa, order floor mats for my Honda Pilot.”
“OK Google, find me a place for tacos right now.”
“Hey Siri, when is World Immunization Week?”
Voice search is more and more a part of our everyday lives. As the technology becomes more commonplace, and as developers expand the number and types of actions you can complete using just your voice, the opportunities for businesses grow and change on a seemingly daily basis.
We’ve written about optimizing for voice search before; here is what we have learned since in preparing our clients for a mobile, screen-less future in search.
Who Uses Voice Search?
- 30% of web browsing sessions will be screen-less by 2020, according to Gartner
- Voice search usage skews heavily toward Millennials—more than 1 out of 3 Millennials do or plan to use a voice-search aided virtual assistant, as compared to just 1 out of every 10 members of the Baby Boomer generation, according to eMarketer
- Millennials are more likely to use voice search in part because they are the largest group of owners of a smart home device, according to Walker Sands
- Younger demographics are more likely to use voice search on a mobile device, according to Global Web Index—25% of users ages 16-24 reported having used a voice search tool on their mobile device in the last month
Why Voice Search?
It is possible to predict why a user might choose to search via voice based on readily available information such as device and location.
Mobile Voice Search is Local SEO
Voice searches originating on a mobile device tend to be location-dependent—that is, users typically search for strings such as, “[service] near me”, or “nearby [product]”.
The optimal strategy for capturing traffic from these voice searches has not changed much since its debut. We know that Google voice search, for instance, relies on structured data of the sort that drives the appearance of featured snippets but which explicitly includes location and other relevant information, such as hours. A thorough local SEO strategy should be sufficient to ensure that your site is positioned to capture such traffic. If you’re not sure if your business or website is already capitalizing on local SEO opportunities, reach out to us!
Smart-home Voice Search is an Ecommerce Opportunity
According to data published via Statista, the general retail ecommerce sector in the US economy is estimated to have totaled over $409 billion in sales in 2017, and is forecast to surpass $638 billion by 2022. Voicebot.ai, meanwhile, pegs the US retail ecommerce voice search market currently as a $1.8 billion segment—a figure expected to rise to $40 billion within the next five years.
Voice search may comprise only a small portion of the retail ecommerce sector at the moment—0.44%, according to the above estimates—but that segment is growing faster than the overall ecommerce sector. Based on the above figures, by 2022, voice search will be component in 6.27% of all ecommerce transactions. The pie is growing, and this slice is growing even faster!
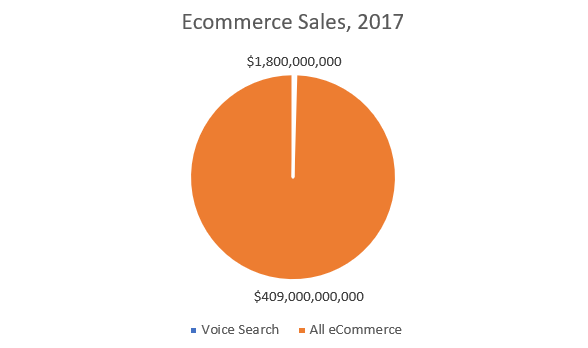
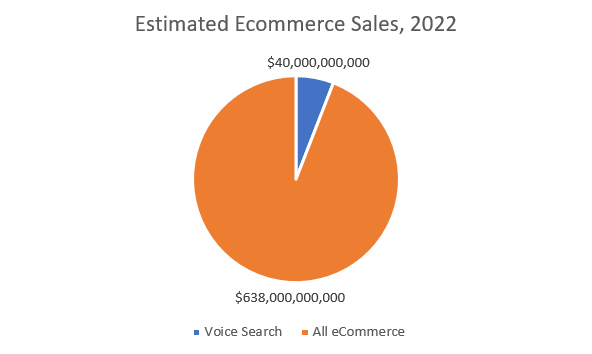
The retail ecommerce pie is growing, and the voice search slice is growing even faster!
The largest share of voice search ecommerce transactions are initiated via a smart-home device. According to GeoMarketing, 82% of Amazon Echo/Dot owners subscribe to Amazon Prime. That fact facilitates roughly two-thirds of purchases, all of which can be categorized as staples—groceries, entertainment, electronics, and clothing.
This represents both an opportunity and an obstacle. Customers are comfortable purchasing staples sight unseen. “Alexa, order Bounty paper towels” is a lot different from “Alexa, order floor mats for my new car.” Shoppers want to discover new products visually; voice search—absent broader integration into a smart home—may not be the right method for that, or one that we would expect users to adopt.
If we are to prepare for a future where shoppers expect to discover and shop for new or novel products via voice search, we likely do not need to significantly alter our strategies. A recent Search Engine Land article laid out what might be over and above what we consider SEO best practices—a list that starts and ends, for most ecommerce retailers, with the suggestion to optimize content for conversational keywords.
Ecommerce and Long-tail Keywords
Conversational keywords can be understood as phrases and complete sentences. Consider the example above—“OK Google, order floor mats for my Honda Pilot.” We would expect a search engine to parse this as “floor mats” + “Honda Pilot”, with search intent clearly aligned around purchasing as opposed to information or research. We would expect a traditional search engine results page to be populated with product pages; we also would expect to see a Google Shopping grid on the right-hand rail. And, what do you know:
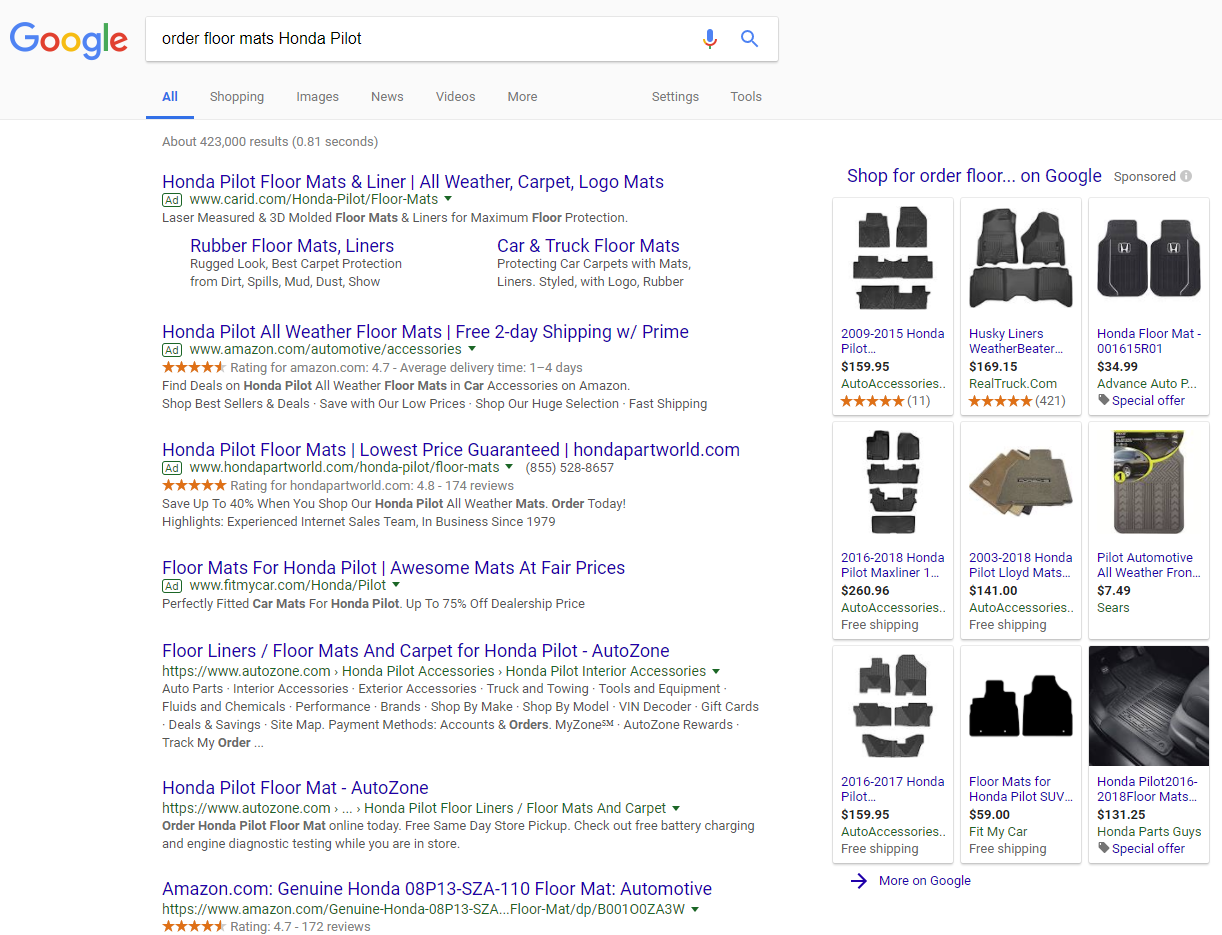
An example of a Google SERP for a long-tail, purchase-motivated search query
Our clients’ sites have gained qualified, purchase-ready traffic with holistic content strategies. By aligning the informational blog posts or evergreen articles with custom product descriptions, we have been able both to improve the average position for target keywords and to increase the total number of keywords for which the page ranks (and, over time, ranks well).

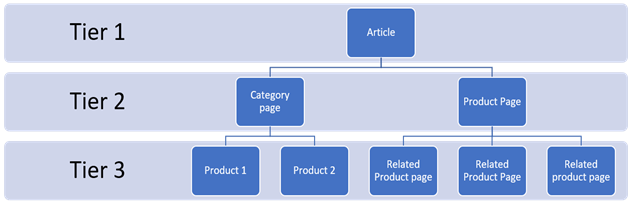
A holistic SEO content strategy maximizes content production beyond the initial article
Many sites assume that blog posts and evergreen articles are the extent of their content production. We have found that nothing could be farther from the truth—in fact, the initial blog post really is the point of origin. Like a radio signal, it spreads across your site via the pages to which it links, and in turn the pages to which they link.
By selecting, for instance, to link to a product with several related products displayed beneath, rather than linking to a dead-end product page, we accomplish a primary eCommerce SEO goal, linking to multiple product pages within three clicks of the homepage.
By writing expanded descriptions on those product pages, we are able to more fully educate search engines as to what products we sell, who might be interested in them, and for what they might be used. In a nutshell, this is semantic SEO.
This type of content is fantastic if you are adhering to Google’s stated mandate—that you design your site to satisfy the user’s intent. Through the lens of voice-search optimization, however, there has to be another side to the coin.
Structured Data
The virtual assistants powering voice search—Alexa, Siri, The Google Assistant; pick your poison—are designed to interpret natural speech. It is possible that, over time, they will be able to crawl, read, and understand normal content with the same level of comprehension as a typical internet user. In the interim, however, we can look at what we know about where virtual assistants find the information they repeat back in response to a voice search.
A recent Backlinko study considered 10,000 Google Home search results. The study includes plenty of valuable insight; here are our 3 key takeaways:
- 41% of voice search answers came from a featured snippet
- The average answer came from a page with a word count well over 2,000
- Very few results had the exact query in their title tag
Each of the above supports the advice we have given our clients on this topic. Featured snippets are important, and there are steps you can take to encourage Google to display information from your site in the knowledge panel, but Google themselves have shown a clear preference for high domain authority sites in this regard, in particular. The best you can do is prepare and develop your site in such a way that it is possible for Google to build a snippet, should they decide doing so is the best way to address a user’s query.
Of course, a featured snippet is not the only use for structured data on your site. And here, we see some of the greatest potential for growth across the voice search ecommerce landscape. Amazon, Apple, and Google all may want to develop their virtual assistants to the point where they easily can parse relevant text out of long-form content—but, in the interim, and if the goal is to answer a user’s ecommerce-related voice search, we can expect them to use the most accurate information available that their respective spiders can readily digest. And that, for now and the foreseeable future, is structured data.
Articles can be associated with the Question schema. There is a product schema, and there is no shortage of additional structured data types, objects, and properties that can be built out for most pages—images, alternative names, prices, dimensions, many of which also have particular machine-readable formats that improve search engines’ understanding of your site.
Optimizing for voice search is little different from optimizing for organic search. One key to success is understanding how voice search engines consume and synthesize information—and how you can use that knowledge to your advantage. Long-form content that thoroughly addresses a search topic paired with structured data highlighting certain questions-and-answers, and extends across the network of interconnected product pages, has proven to be effective for us in achieving growth for our clients.
by Charles River Interactive | May 1, 2018 | Analytics, Industry Trends, Organic Search, Paid Search, PPC, SEO
What is Google Data Studio?
Google Data Studio is one of the newest additions to the Google Analytics 360 Suite. This interactive data visualization tool was moved out of BETA stage in late Spring of 2017 and continues to evolve weekly. The easy to use tool allows marketing professionals to pull information from multiple data repositories into one centralized, live, visually appealing, interactive dashboard. Google Data Studio dashboards allow its original owner to share important data sets while maintaining control of what information can be accessed. The Data Studio dashboards are perfect for internal use but are equally as valuable for client reporting. Typical to most Google products, the dashboards are saved automatically online within your Data Studio account and can be edited by multiple users at the same time. In a nutshell: Google Data Studio allows all businesses (large or small) to visualize data in a simplistic and efficient manner!

Why Should You Use Google Data Studio?
Google Data Studio is an incredibly powerful visualization tool. The ability to bring in data from multiple sources on one page at the same time gives you the flexibility and ease to consolidate reporting platforms. Are you interested in seeing how your Paid Search efforts have changed Month-over-Month, but also want to see Year-over-Year results at the same time? Not a problem! Or are you trying to determine which channel converts best on a mobile device? After implementing a few filters within your report, this information is only one click away! There are countless reasons why we believe marketing professionals everywhere should be taking advantage of Google’s new reporting tool. Below are the top 5 reasons why we have adopted Google Data Studio as our primary reporting tool here at Charles River Interactive.
1. It’s FREE!
Google Data Studio is free of charge. All you need to do is create a Google account. While in the BETA stage, Data Studio only allowed a maximum of 5 reports, limiting its abilities to be used by marketing agencies and small businesses alike. Google has since removed this limitation and you are now able to create as many reports as you need. Comparable products such as Tableau, Qlikview, FusionCharts, Plotly, and many more can cost over thousands of dollars a month.
2. Endless Customization Options
Let’s be honest, reporting can sometimes be tedious… but not anymore! Google Data Studio provides you with the ability to change colors, fonts, background images, and essentially everything you need to make your reporting look top notch. Here at Charles River Interactive, we understand everyone prefers to look at data differently. Google understand this as well and thus has provided multiple options on how you are able to present your data. Pie charts, pivot tables, line graphs, bar graphs, tables, geo maps, scatter charts, area charts, bullet charts…. Google Data Studio has you covered.
3. Calculated Fields
Are you looking to transform, categorize, and make calculations within your data? Are the default dimensions and metrics from your data repository just not enough? Calculated fields give you the ability to create new dimensions and metrics in your data source that perform arithmetic, apply mathematical formulae, extract or transform text, or return new information based on logical comparisons. Once the calculated field has been established, you are able to use the new dimensions and metrics in charts and filters, just like the default fields. This means grouping pages, creating ratio formulas and custom naming conventions can now all be done within the visualization tool itself.
4. Community Connectors
Out of the box, Google Data Studio natively connects to other Google products such as Analytics, AdWords and Sheets. However, at Charles River Interactive we understand that many businesses operate and report on multiple different data sources outside of the Google family. This is where the power of Data Studio Community Connectors comes in! The best way to think of a Community Connector is to visualize it as a pipeline between Data Studio and your favorite web service, where your data is stored. As mentioned before, Google continues to make small upgrades to the Data Studio platform and one of those upgrades includes an option for third-party connectors such as Supermetrics. These third-party connectors allow you to easily bring in data from sources such as Bing Ads, DoubleClick, Facebook Ads, LinkedIn Ads, Twitter Ads, and Yahoo Gemini to name a few. Once the third-party connection is setup, the process for creating reports is the same as when you are using a Google data source.
5. Sharing Capabilities
Google Data Studio is built to efficiently optimize collaboration capabilities. Much like a Google Doc or Sheet, Data Studio allows you to seamlessly share your report with others by simply sending them a URL link. Data Studio also provides you with the ability to control how each user can interact with the dashboard by assigning “view” and “edit” limitations. These sharing options give you (the report owner) total control and allow you to easily collaborate with clients and teammates without having to exchange password information that could in turn provide access to your Google Analytics account.
Getting Started
So now that you better understand some of the capabilities and power of Google Data Studio, you are probably wondering how do I get started? Luckily, we have put together easy to follow instructions on just how do that.
1. Establish a Google Data Studio account. Most people choose to use the same account as their Analytics & Search Console setups. We recommend this method (utilizing the same account login email as the one you have for Analytics & Search Console) as this will make the sign-up process quicker and easier.
2. Complete the tutorial. Google offers an extremely helpful tutorial to get you up and running. It only takes about 30 minutes to go through the tutorial and by the end, you will know enough to create your own very first dashboard.
3. Explore the Data Studio Report Gallery. This report gallery is a collection of both Google product templates and user submitted dashboards that are available to you, free of charge! We have found these templates to be tremendously useful and instructive when trying to display data effectively.
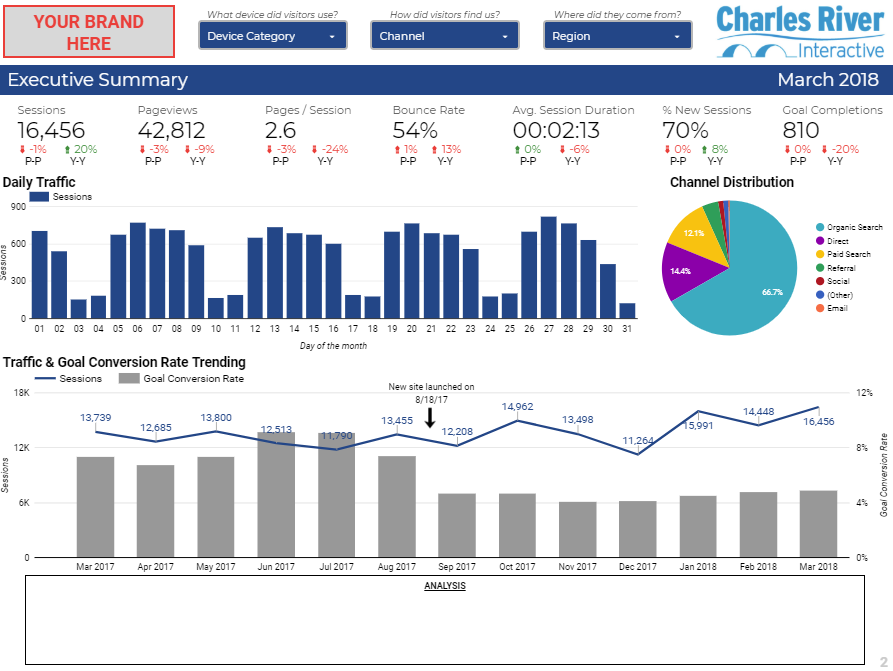 An example of a Charles River Interactive analytics dashboard
Final Thoughts
In the competitive business landscape we operate in today, being able to make data driven decisions is more important than ever. Google Data Studio provides organizations of all sizes the ability to easily visualize their data in ways that will foster new insights and recommendations. Here at Charles River Interactive we use this tool on a daily basis, we set up reports for our various clients, and we believe that other businesses would benefit immensely from using it as well. So, what are you waiting for? Stop laboring over messy excel spreadsheets and manual diagrams and start creating professional looking reports by leveraging the power of Google Data Studio!
We hope you enjoyed learning more about Google Data Studio and some of its incredible capabilities. At Charles River Interactive, we believe Google Data Studio is revolutionizing the data visualization game. Still have questions? Or want to share what you love most about Google Data Studio? Reach out to our Integrated Web Services team at info@charlesriverinteractive.com.