Google Marketing Live is one of the biggest days on the marketing calendar. The event recently came and went and, as per usual, Google announced some huge advancements within their suite of marketing products and platforms. And while artificial intelligence might be some years away from ensuring your fridge “magically” remains stocked through the holidays and that no appointment goes missing from your calendar, it is ready to make a real impact on your marketing efforts as soon as today.
Artificial Intelligence: The Future of Marketing Begins Today
Perhaps no unveiling was more seismic to how we do and will work with our clients than Google’s announcement that they have fully embraced artificial intelligence across their marketing platform.
Automation is here and here to stay! But what exactly does that mean?
The algorithms that govern search engines are becoming smarter. The ability to learn user behavior in turn means that paid search strategies need to account for this newfound and expansive ability to speak to and capture specific, valued audiences. Google has launched some new products in order to help marketers develop these strategies including Responsive Search Ads, Advanced Audience Targeting and Automated Shopping Feeds, as well as some new tools to help marketers optimize and understand the user experience, such as Mobile Landing Page Speed and Cross Device Reporting.
Responsive Search Ads
One of the products announced, Responsive Search Ads, promises to make A/B testing on ad copy a whole lot easier. As a Premier Agency Partner with Google, Charles River Interactive has had early access to this tool across several of our clients’ accounts.
The tool, which is powered by Google’s Machine Learning, is able to incorporate up to 15 headlines and 4 descriptions into an ad set, with Google then taking the option to mix and match headlines and descriptions and automatically test for optimal performance. How convenient! Once a combination has been determined to be the most successful, Google then shows that ad the most.
Advanced Audience Targeting
Have you ever taken a survey on YouTube to skip to the video? That’s Google gathering information about you!
Google has leveraged this data in creating their Advanced Audience Targeting. The data comes from YouTube and other channels and Google has compiled multiple audiences to allow more refined targeting.
CRI is already leveraging this tool across several accounts. We are able to observe multiple and diverse audiences and assess the topics and content that best lead to conversions. As data accrues, we also are able to credit a specific audience with a higher conversion rate, and to make bid adjustments accordingly—for instance, by exceeding our maximum bid for a specific audience because we know the audience will convert at a high rate.
Automated Shopping Feeds
Scheduled to launch later this year, Automated Shopping Feeds promises to remove a significant barrier to entry into the ecommerce space. It would be hard to argue that brick-and-mortar retail is thriving and, as more people look to begin and complete their shopping solely online, it is more important than ever to have your products available for purchase online.
Automated shopping feeds will rely on Google’s spiders to crawl your ecommerce website. That crawl will allow Google to generate a shopping feed. That is countless labor hours of data entry and management that can be reallocated across your organization, as you will no longer have to manually create and maintain a shopping feed across inventory hiccups or new product roll-outs.
Why CRI is excited: Less time on management means more time to implement better strategies within campaigns, driving a great ROI for our clients.
Smart Shopping Campaigns
Along with automated shopping feeds, Google also introduced Smart Shopping campaigns. These enable marketers to surface the most relevant product to in-market searchers at the precise right time. The machine learning and artificial intelligence underpinnings also make it straightforward to optimize around specific goals, whether revenue, conversion rate, or something else entirely. Within a Smart Shopping campaign, Google will test different combinations of image and text, in addition to automating ad placement and bidding for maximum conversions.
Mobile Landing Page Speed Score
The already-released Mobile Landing Page Speed Score evaluates a single page on your site according to a 10-point scale. Since half of all web traffic comes from mobile devices, this is already beneficial to our web services clients.
The tool highlights available landing page optimizations that will improve pageload speed on a mobile device; for many clients, we are able to immediately implement these optimizations. Since the tool is updated twice daily, we also receive near-immediate feedback, and can inform our client with little delay if our optimizations are having the expected effect—and not just on pageload speed, but also on KPI’s ranging from engagement metrics to revenue and everything in between.
Cross-Device Reporting
Assessing mobile performance in isolation, and following a user across devices, has been a common issue for many of our clients over the years. That makes the unveiling of cross device reporting through Google Analytics 360 that much more exciting.
Now, it will be that much simpler to follow a user, for instance from their discovery of our site via an organic search on a mobile device to their conversion via a remarketing ad on their desktop. Along with machine-learning driven advancements in attribution modeling, cross-device reporting moves us that much closer to holistically understanding user behavior during the shopping and conversion process.
Google Data Studio: Data Blending
Over the past year and a half, Google has consistently rolled out additional features for its data visualization tool, Google Data Studio. We have already gone over some of the key benefits of this tool and why we believe it is revolutionizing the data visualization game in a previous post.
At the 2018 Marketing Innovations Keynote, however, Google dropped a bomb on us, in the form of Data Studio’s newest feature, called “Data Blending”.
To understand why this update is so important and how to best use this new feature, think back to the difficulties you and your team might have encountered in trying to stack multiple chart elements pulled from different data sources, one on top of another. What once required labor-intensive data pulls and error-prone data manipulation is now accomplished in just a few clicks.
As an example, a client requested Google Search Console impressions, Google Analytics pageviews, and Google Ads clicks in a single chart. Prior to this update, GDS only allowed one data source per visualization, leaving a gap in the story our data was able to tell—or, perhaps an even worse fate, forcing our poor marketing analysts to resort to Excel and other tools to combine data before it could be warehoused in Google Sheets and, from there, brought into a Data Studio visualization.
The only requirement for data blending is that each source have what Google refers to as a “join key”, a term used for dimensions that are shared amongst two or more data sets. In many cases a join key can be a simple dimension—date, channel, user ID, etc. Blending data off of a shared dimension creates the opportunity for more in-depth reporting, including:
Contextualizing online performance using offline metrics such as weather, stock market trends, and unemployment rate
Comparing goals across multiple Google Analytics properties and views
Assessing paid media campaign performance as compared to onsite website performance
One of the most requested features in the brief history of Data Studio just launched and we couldn’t be more excited about the avenues to optimization it will create. This will truly enhance the power of Data Studio, taking the tool to whole new level.
Some closing thoughts
Google AdWords, which is now rebranded as Google Ads, is getting faster, getting smarter, and getting personal. The ability to group users into audiences will provide refined targeting. Digital marketing is shaping the world we live in, and Google’s artificial intelligence is controlling the devices that we use. CRI leverages our team and their deep knowledge of and enthusiasm for the industry to strategize the right mix of digital marketing to make you and your brand successful.
By now most marketers have realized the reporting advantages of Google Data Studio. It offers advanced reporting visualization and an impressive level of customizability to show data in the best way for your visualization needs. Check out our previous blog to learn more about Data Studio.
What is Supermetrics?
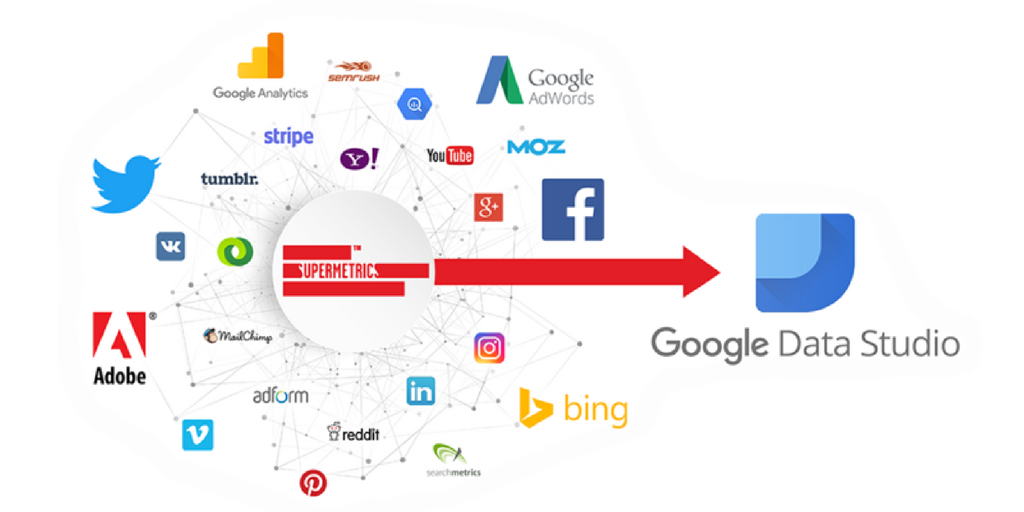
Supermetrics is an Application Programming Interface (API), which is a fancy way of saying it’s a software that allows two applications to talk to each other. In this case, Supermetrics allows marketing platforms, like Facebook, to send data directly into Data Studio. No more exporting and manipulating data in Excel or Sheets for reporting!
In most organizations, and in virtually every marketing agency, reporting requires a significant time investment for data exporting and manipulation, often in either Excel or Google Sheets. At Charles River Interactive, we estimate adopting Google Data Studio with the Supermetrics API has saved us over 150 hours of work. That’s more time we get to spend focusing on driving results for our clients.
Why do you need Supermetrics?
A key selling point for Data Studio is the ease of integration with certain marketing platforms—in particular, with Google’s owned properties, including AdWords and Google Analytics. And, while that might account for a fair amount of many companies’ marketing efforts, there is no shortage of ad networks or marketing tools. The Supermetrics API lets you easily bring even more data sources into Data Studio!
Supermetrics allows you to connect non-Google platforms to Data Studio. It has over 30 connectors, including Bing Ads, Facebook Ads, LinkedIn Ads and more! Within each connector, you are able to blend data from more than one account.
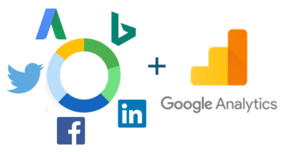
Combine Ad Data and Google Analytics Data
The Ad Data + Google Analytics connector allows you to merge data from different ad networks and Google Analytics. You can combine data from any of the following into one data source; Facebook Ads, Google AdWords, Bing Ads, Twitter Ads, LinkedIn Ads, and Google Analytics. There are many useful arrangements of data now possible with this connector!
Pro Tip 1 – Connect Google Analytics to each of the ad networks to see how users from different ad networks behave on your site.
Pro Tip 2 – Merge Google AdWords and Bing Ads data to get a holistic view of PPC performance.
Pro Tip 3 – Connect all your social networks to see your overall social performance and compare performance across platforms effortlessly.
Improved Google connectors
Google Data Studio has 14 Google Connectors, build and supported by Data Studio, including Google Analytics and Google AdWords. Supermetrics provides improved versions of some of these Google Connectors.
The Supermetrics Google Analytics connector allows you to connect as many Google Analytics views and segments as you want, in an easy to use drop-down menu. Data sampling in Analytics is also a problem when reporting on long date ranges or websites with high traffic volume. The Supermetrics Google Analytics connector allows you to avoid sampling by selecting the “try to avoid sampling” option in the data source menu. The connector will partition the data into smaller queries in order to process the data without sampling. Note that when using this feature it may take several minutes to process the data request, as in most cases this is why Google samples the data.
The Supermetrics AdWords connector also allows you to connect more than one account to a single data source—if, for example, you had three different AdWords accounts but you wanted to display the overall performance across all accounts. Another unique feature of this connector is the historical quality score metric.
Historical quality score is one of AdWords’ newer metrics. It reflects how relevant your ad is to the user-specific search query. This connector also pulls in placement metrics for your Display Network campaigns, including Placement URL, Domain, Placement status, Extension type, and Placement destination URL. These metrics are not available in the stock Google connector.
5 Ways Supermetrics will enhance your Data Studio reporting
In Conclusion
You haven’t even cracked the full potential of using Data Studio if you haven’t integrated it with Supermetrics. If this article gets you interested in trying out Supermetrics with Data Studio for your organization, there is a 14-day free trial! There is also a free “hobby” level of access which only allows you to see the last 10 days of data, but that’s enough for you to see firsthand that you’re missing out on the full potential of Data Studio if you haven’t integrated it with Supermetrics.
These five advantages are just the beginning; you can do so much more with Supermetrics for Data Studio. Move your organization away from manual data reporting. Use your time for more productive things!
Now go and enhance your Data Studio reports with Supermetrics!
What is Google Data Studio?
Google Data Studio is one of the newest additions to the Google Analytics 360 Suite. This interactive data visualization tool was moved out of BETA stage in late Spring of 2017 and continues to evolve weekly. The easy to use tool allows marketing professionals to pull information from multiple data repositories into one centralized, live, visually appealing, interactive dashboard. Google Data Studio dashboards allow its original owner to share important data sets while maintaining control of what information can be accessed. The Data Studio dashboards are perfect for internal use but are equally as valuable for client reporting. Typical to most Google products, the dashboards are saved automatically online within your Data Studio account and can be edited by multiple users at the same time. In a nutshell: Google Data Studio allows all businesses (large or small) to visualize data in a simplistic and efficient manner!
Why Should You Use Google Data Studio?
Google Data Studio is an incredibly powerful visualization tool. The ability to bring in data from multiple sources on one page at the same time gives you the flexibility and ease to consolidate reporting platforms. Are you interested in seeing how your Paid Search efforts have changed Month-over-Month, but also want to see Year-over-Year results at the same time? Not a problem! Or are you trying to determine which channel converts best on a mobile device? After implementing a few filters within your report, this information is only one click away! There are countless reasons why we believe marketing professionals everywhere should be taking advantage of Google’s new reporting tool. Below are the top 5 reasons why we have adopted Google Data Studio as our primary reporting tool here at Charles River Interactive.
1. It’s FREE!
Google Data Studio is free of charge. All you need to do is create a Google account. While in the BETA stage, Data Studio only allowed a maximum of 5 reports, limiting its abilities to be used by marketing agencies and small businesses alike. Google has since removed this limitation and you are now able to create as many reports as you need. Comparable products such as Tableau, Qlikview, FusionCharts, Plotly, and many more can cost over thousands of dollars a month.
2. Endless Customization Options
Let’s be honest, reporting can sometimes be tedious… but not anymore! Google Data Studio provides you with the ability to change colors, fonts, background images, and essentially everything you need to make your reporting look top notch. Here at Charles River Interactive, we understand everyone prefers to look at data differently. Google understand this as well and thus has provided multiple options on how you are able to present your data. Pie charts, pivot tables, line graphs, bar graphs, tables, geo maps, scatter charts, area charts, bullet charts…. Google Data Studio has you covered.
3. Calculated Fields
Are you looking to transform, categorize, and make calculations within your data? Are the default dimensions and metrics from your data repository just not enough? Calculated fields give you the ability to create new dimensions and metrics in your data source that perform arithmetic, apply mathematical formulae, extract or transform text, or return new information based on logical comparisons. Once the calculated field has been established, you are able to use the new dimensions and metrics in charts and filters, just like the default fields. This means grouping pages, creating ratio formulas and custom naming conventions can now all be done within the visualization tool itself.
4. Community Connectors
Out of the box, Google Data Studio natively connects to other Google products such as Analytics, AdWords and Sheets. However, at Charles River Interactive we understand that many businesses operate and report on multiple different data sources outside of the Google family. This is where the power of Data Studio Community Connectors comes in! The best way to think of a Community Connector is to visualize it as a pipeline between Data Studio and your favorite web service, where your data is stored. As mentioned before, Google continues to make small upgrades to the Data Studio platform and one of those upgrades includes an option for third-party connectors such as Supermetrics. These third-party connectors allow you to easily bring in data from sources such as Bing Ads, DoubleClick, Facebook Ads, LinkedIn Ads, Twitter Ads, and Yahoo Gemini to name a few. Once the third-party connection is setup, the process for creating reports is the same as when you are using a Google data source.
5. Sharing Capabilities
Google Data Studio is built to efficiently optimize collaboration capabilities. Much like a Google Doc or Sheet, Data Studio allows you to seamlessly share your report with others by simply sending them a URL link. Data Studio also provides you with the ability to control how each user can interact with the dashboard by assigning “view” and “edit” limitations. These sharing options give you (the report owner) total control and allow you to easily collaborate with clients and teammates without having to exchange password information that could in turn provide access to your Google Analytics account.
Getting Started
So now that you better understand some of the capabilities and power of Google Data Studio, you are probably wondering how do I get started? Luckily, we have put together easy to follow instructions on just how do that.
1. Establish a Google Data Studio account. Most people choose to use the same account as their Analytics & Search Console setups. We recommend this method (utilizing the same account login email as the one you have for Analytics & Search Console) as this will make the sign-up process quicker and easier. 2. Complete the tutorial. Google offers an extremely helpful tutorial to get you up and running. It only takes about 30 minutes to go through the tutorial and by the end, you will know enough to create your own very first dashboard. 3. Explore the Data StudioReport Gallery. This report gallery is a collection of both Google product templates and user submitted dashboards that are available to you, free of charge! We have found these templates to be tremendously useful and instructive when trying to display data effectively.
An example of a Charles River Interactive analytics dashboard
Final Thoughts
In the competitive business landscape we operate in today, being able to make data driven decisions is more important than ever. Google Data Studio provides organizations of all sizes the ability to easily visualize their data in ways that will foster new insights and recommendations. Here at Charles River Interactive we use this tool on a daily basis, we set up reports for our various clients, and we believe that other businesses would benefit immensely from using it as well. So, what are you waiting for? Stop laboring over messy excel spreadsheets and manual diagrams and start creating professional looking reports by leveraging the power of Google Data Studio!
We hope you enjoyed learning more about Google Data Studio and some of its incredible capabilities. At Charles River Interactive, we believe Google Data Studio is revolutionizing the data visualization game. Still have questions? Or want to share what you love most about Google Data Studio? Reach out to our Integrated Web Services team at info@charlesriverinteractive.com.
Technology is advancing daily and with that; we are utilizing these advancements to capture seemingly endless amounts of data. Look at companies like Nest, Uber and even Tesla; all three are not only revolutionizing our everyday lives with their products/services; but are also turning our everyday activities into trackable data points.
Why Data Capture Matters for Digital Marketing
What many consumers may not realize is that each action and interaction we have with these company’s apps, websites, or smart devices is paving the future for each of these companies and enabling them to grow.
Tesla for example, installed Autopilot hardware on every car it’s produced since October 2014, when Autopilot was still a pipe dream. Although the 1.3 billion miles of data may not have seemed extremely relevant in 2014, the race to produce an autonomous car has since picked up. Tesla now has a clear advantage over competitors like Google, General Motors and Uber.
Much like Tesla and its 1.3 billion miles of data, you too should be capturing as much data as possible from your website and paid advertising campaigns. A good data capture strategy will deliver high quality customer data, allowing you to better understand your customers and enhance your relationship with them. At the same time, giving you a leg up on your competition.
How to Capture Data in Google AdWords
Not everyone can have the same foresight as Tesla, but it is a good idea to track as much as you can, as soon as possible.
The good news is that without doing anything, the Google AdWords interface is set up to track a variety of ad specific metrics like Impressions, Clicks, CPC, CTR and so on. What it does not do out of the box, is track conversions. You will need to set up a conversion tracking code – also called a “tag” or “pixel” – to send conversion data from your website to Google.
Capturing conversion data is important in order to have full transparency into what visitors clicking on your ads are doing on your website after that first click. To set up conversion tracking on your website, follow the steps provided by Google here. Once you’ve set up your conversion tracking tag in AdWords, you will need to place the code or “tag” between the body tags (<body> </body>) of the page where the conversion takes place. To do this, you will need the ability to edit your website. After the tag is placed, you should be all set and your web page should be capturing conversion data. From there you can configure your AdWords dashboard to display only the information relevant to you and even export the information in a custom report. More on setting up tracking can be found here.
Utilize Data with Google Tag Manager and Analytics
The data available via Google AdWords is great, but sometimes, you just need more. This is where Google Tag Manager (GTM) and Google Analytics come in.
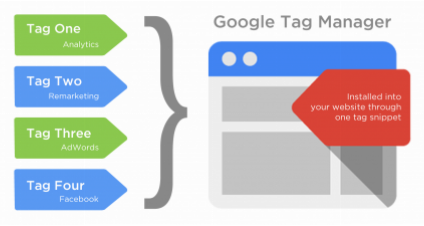
Tag Manager is an easy-to-install service offered by Google. GTM allows you to set up an interface to build “Tags” (also known as pixels) to track and evaluate visitor interactions on your site through Google Analytics as Events and Goals. Google Tag Manager can be used to display multiple sources of data in one centralized location. It is used to provide you with the most complete picture of your website traffic and advertising campaign data.
From here, you can build multiple “tags” in GTM that will allow you to:
Track AdWords Conversions
See website and conversion data in Google Analytics
Track Facebook conversions and even remarket to customers who have clicked on your site/ad but did not convert.
This image provides a visual example of a Google Tag Manager account with four tags pulling data from four different data sources.
Google Analytics is simply a free advanced web analytics service used to dive even deeper into the data captured from your website. This powerful tool allows you to keep your finger on the pulse of your business and provides you with significant insight into your customer base.
Google Analytics allows you to not only observe actions from a high level, but dive deep into your data to learn things like:
What age group is buying your product
Where your best customers/visitors are located in the world
What keywords people searched to land on your website
By searching for and analyzing these trends, you can now have concrete data to influence and justify changes to your website/paid advertising accounts. By utilizing this data, you can quickly optimize your website/ads to lower your conversion costs and also, save your business money in the long run.
Data Capture Strategy Expertise at Charles River Interactive
In 2017, we at CRI predict data will only continue to increase in importance. We recommend you make it a new year’s resolution to avoid assumptions you can’t back up with data. Your starting point? Take the time to establish a clear data capture strategy.
At CRI, our Integrated Web Services team can help to harness the potential of data analysis and make recommendations for improvements along the way. And, together, we work closely with clients to properly set up tracking using the latest tools so our clients can collect as much data as possible, because much like Tesla, you never know when you will need it.
Your developers, SEO and paid search teams have come together to build a website that is driving traffic in volumes and surpassing your most optimistic estimates. Plus, the reports you’re getting from Google Analytics tell a positive story of highly engaged users.
From Google Analytics, you are learning how users came to your site, what pages they visited and how they engaged with your content.
But this data only tells part of the story. You want to know more about what users are actually doing on your site. Google Tag Manager is a free, effective tool that tracks user behavior.
What is Google Tag Manager?
Google Tag Manager (GTM for short) is a free easy-to-install service offered by Google. GTM allows you to set up an interface to build “Tags” (also known as pixels) to track and evaluate visitor interactions on your site through Google Analytics as Events and Goals.
You will gain valuable information about your audience reach, visitor experience and navigation, and path to conversion.
Why Use Google Tag Manager?
Here are three top reasons to start using Google Tag Manager on your site:
Streamline your tags: Adding and managing tags can be time-consuming and messy. With GTM, you do not need to re-code your site. GTM provides your development team with a block of code to add to the opening <body> tag of each page you want to track.
Improve site function: Once in place, the GTM online menu interface allows you to immediately build, test and publish your tags within minutes. Because the tracking tags are not hard coded, your site load time, a critical component of the user experience, can improve and may reduce visitor site abandons due to slow load times.
Benefit from versatility: The data from these tags is not just limited to Google properties such as AdWords and DoubleClick. You can also collect multiple third-party applications such as Comscore, Facebook and Marin. You can add further customization by using HTML and JavaScript-based tags, variables, and triggers.
How to Implement Google Tag Manager
Google Tag Manager opens up a universe of new data and analytics possibilities to uncover new insights into your website performance. Charles River Interactive (CRI) has developed an end-to-end strategic and targeted GTM implementation approach with our search partners. We lay the GTM framework with defined goals, naming conventions, and deployment stages. Instead of a flood of raw data, CRI lets your metrics tell a story about your audience and their experience on your site. This brings about actionable insights and solutions to improve your website and marketing strategies.
Helpful Tools to Learn Google Tag Manager
Interested in learning more about GTM and how to apply it? Here are some helpful tools and resources:
On April 2nd, Google announced that the Universal Analytics product was moved out of Beta and ready for primetime.
Yes, like Deion Sanders but also completely different…
Is Universal Analytics really ready for “primetime”?
Here at CRI, previous to this announcement, we were hesitant to instruct clients to upgrade to the latest version of Google Analytics because it was missing a critical component for Search Marketers – Remarketing.
The move of Universal Analytics out of Beta was part of Google’s Phase 3 (of 4) for the rollout of Universal Analytics. This phase included Remarketing; (more…)
With objectives that uncover your target audiences. With insightful, actionable analytics that drive integrated digital marketing solutions. And, with proven tactics, tools, and strategies that achieve measurable results.
We’ll create a comprehensive strategy that will help you harness the potential of digital marketing—built around a solid search engine marketing core—to achieve the business goals you want and need. By creating an integrated digital marketing plan that’s driven by data and delivers optimum results, we’ll become a trusted partner who feels like part of your in-house team.
 Pro Tip 1 – Connect Google Analytics to each of the ad networks to see how users from different ad networks behave on your site.
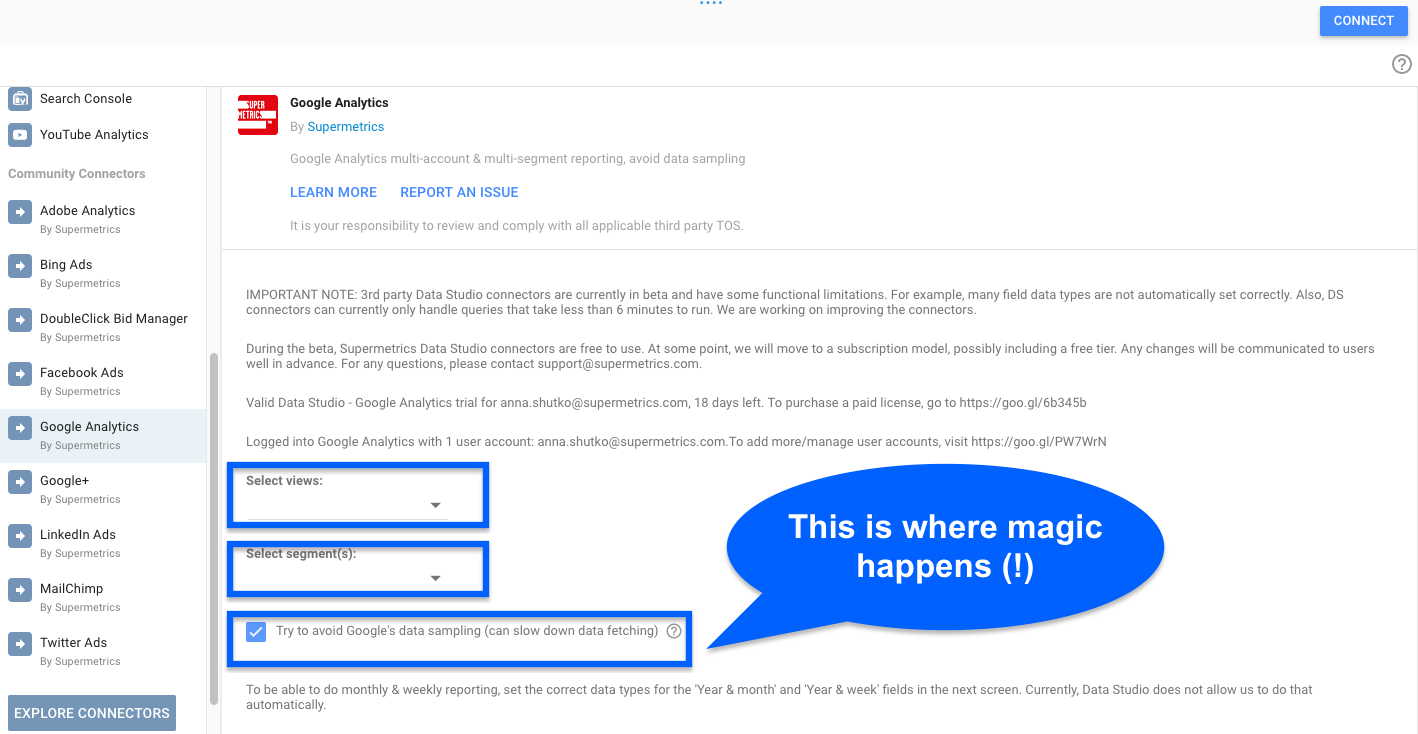

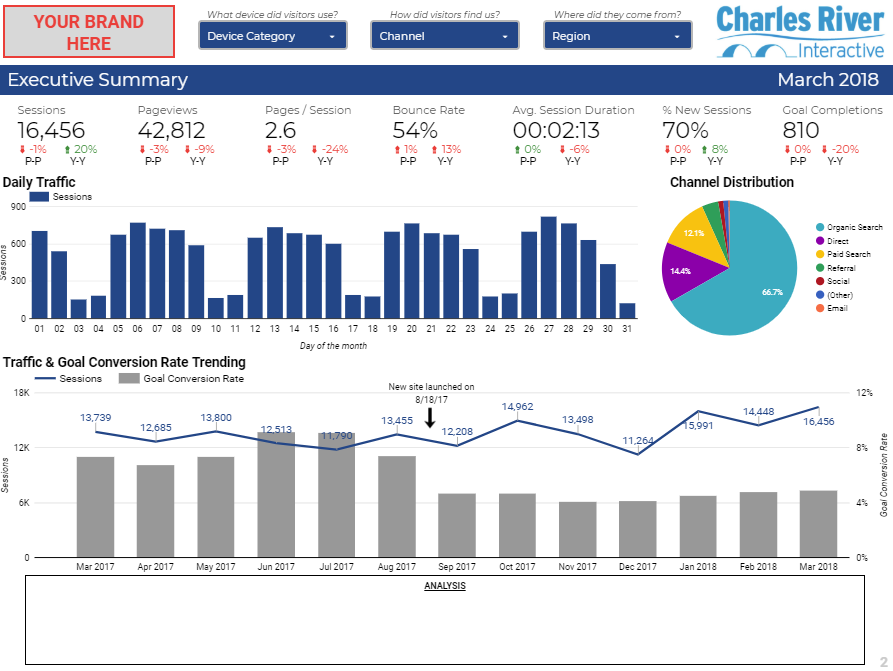 An example of a Charles River Interactive analytics dashboard